

Isioma Jessica Nwayor, MSc., BSc.,
is a final-year PhD student at Indiana University Bloomington, pursuing a degree in Geography with a minor in Earth and Atmospheric Science. She is expected to graduate in May 2026. Her research focuses on evaluating extreme weather patterns and their impacts on vegetation and water resources. With a strong background in data analysis and climate modeling, Isioma has over four years of work experience leading climate resilience projects for private firms, municipalities, and research institutions.
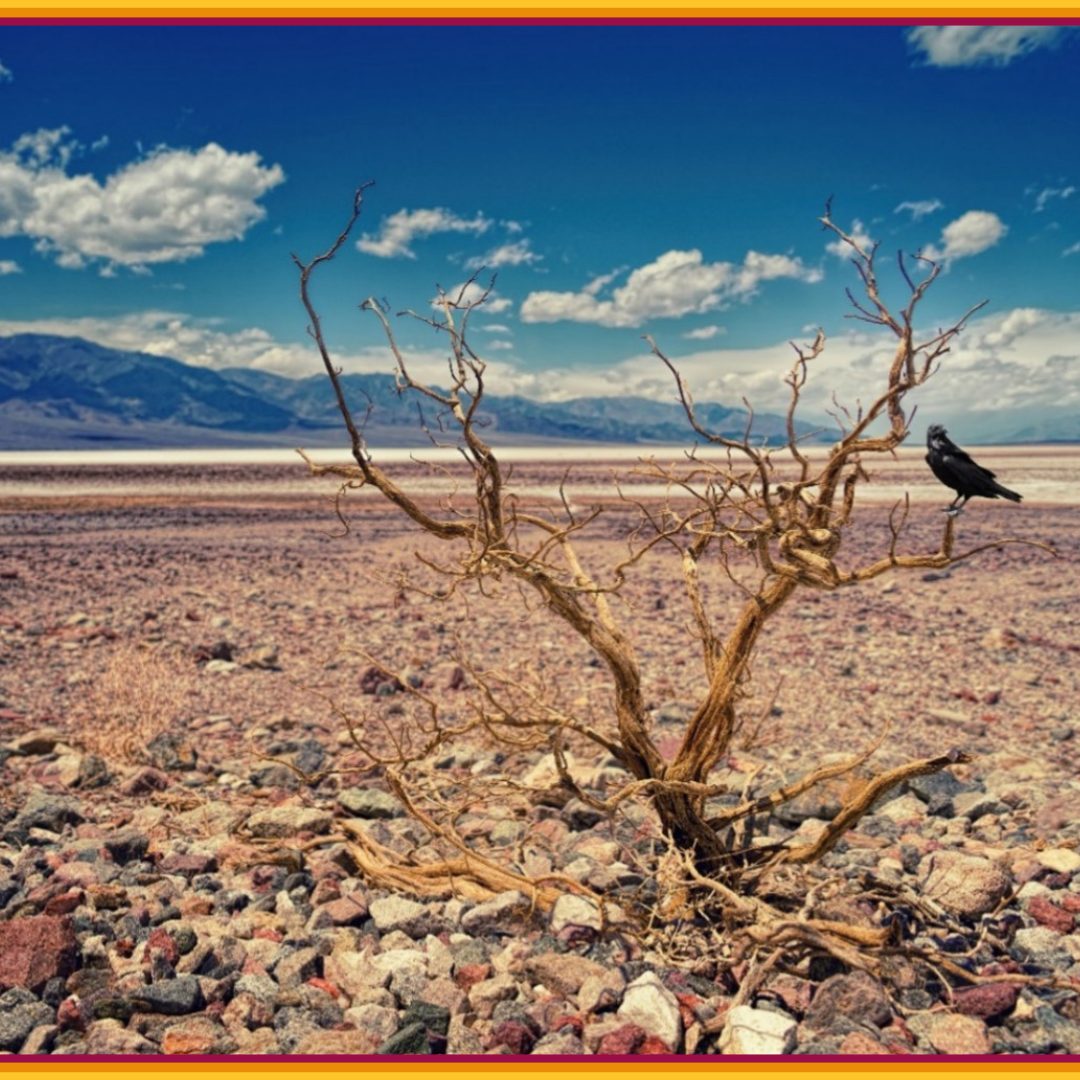
Rising temperatures over the past decades have amplified the processes that naturally cause droughts, resulting in longer and more severe conditions (Mukherjee et al., 2018). As prolonged periods of insufficient atmospheric water supply or high atmospheric water demand that can last for weeks, months, or even years, droughts impose substantial and compounding financial burdens, which are projected to persist and intensify in the future for insurance companies and other financial institutions (Cho, 2022; Garza, 2025).
Between 1980 and 2024, the United States experienced 32 drought events that have cost a total of $367.6 billion, with an average cost of about $11.5 billion per event (NCEI, 2024). For insurance companies, droughts create substantial financial pressure by increasing exposure to risk and claims from farmers and businesses dependent on water availability and agricultural productivity. For example, in the agricultural sector, drought-related damages to farm produce have driven indemnity payments to farmers to rise by 690%, increasing from $965.5 million in 2001 to $7.6 billion in 2022 (Schechinger, 2023). In addition, drought is not a standalone extreme event; it triggers cascading impacts that amplify the frequency and severity of other climate extremes, including wildfires (Luo et al., 2024), flash floods (Alessi, 2025), and heatwaves (NOAA & NIDIS, 2025), which further drive increases in insurance claims, raise premiums, and elevate long-term financial risk for insurers.
Drought is a multifaceted phenomenon because it represents an imbalance between water supply and demand that is influenced by different variables in the water cycle. Because of this, drought cannot always be evaluated using a single variable; instead, it is usually described in multiple forms. For example, meteorological drought is defined as precipitation deficits (i.e., shortage of rain or snow), agricultural drought is related to a decline in soil moisture, and hydrological drought occurs when there is depletion in groundwater storage. As a result, drought is commonly evaluated using tools developed from the variables in the water cycle that drive different drought conditions.
Drought indices are quantitative tools that provide a numerical indication of the amount of moisture—or lack thereof—in a given region relative to its long-term average (McKee et al., 1993; Nwayor et al., 2024; Vicente-Serrano et al., 2010). Different drought indices are developed using specific variables that drive water availability. For example, the Standardized Precipitation Index (SPI; McKee et al., 1993) is a widely used drought index that is based solely on precipitation. Because SPI is expressed as relative to typical conditions, it indicates anomalous changes in precipitation, which have different implications for various climate regions. For instance, in a humid region such as New Orleans, Louisiana, where average annual precipitation is approximately 63 inches, a decrease to 58 inches in a year may appear substantial but may translate to a relatively modest change in SPI because precipitation has a larger range in humid regions. In contrast, in an arid region such as Phoenix, Arizona, where average annual precipitation is about 8 inches, a decline by 5 inches may represent a larger change in SPI that could cause more plant water stress compared to plants in humid regions that are more adapted to that amount of change in precipitation. This means that while a precipitation decline of a given magnitude can induce drought conditions at one location, it may also represent normal or wet conditions at another location, which would be difficult to compare using raw precipitation data. Therefore, unlike direct climate and hydrologic variables (i.e., precipitation, soil moisture, etc.), SPI and other complementary drought indices, which are expressed on a standardized scale, make it possible to compare normal and unusual moisture conditions across different climate types.
To support planning and risk management, drought indices can be used to make projections about future drought events under different climate scenarios. Specifically, insurance companies can integrate these indices into their catastrophe models to inform risk assessments, pricing strategies, and claims management. In doing so, insurers can anticipate drought impacts on crops, livestock, and water-dependent businesses, and detect warning signs—such as extreme soil dryness or high atmospheric water demand—that often precede or worsen other extreme events such as wildfires, flash floods, and heatwaves. This information will help insurers adjust premiums and develop targeted risk mitigation strategies to reduce potential financial losses.
Handle Restaurant Risks like a Pro!
The Restaurant RiskPRO certification gives insurance professionals the tools to understand and manage the unique exposures of restaurants and food service businesses.
Learn how to address coverage gaps, reduce risk, and deliver stronger protection for your clients in this specialized program.
For more information, see:
References
- Alessi, M. (2025, July 22). “Hydroclimate whiplash”: How extreme rainfall and drought are linked. Retrieved from Union of Concerned Scientists.
- Cho, R. (2022, November 3). With climate impacts growing, insurance companies face big challenges. Retrieved from Columbia Climate School.
- Garza, F. (2025, May 14). As temperatures rise, the US Corn Belt could see insurance claims soar. Retrieved from Grist.
- Luo, K., Wang, X., de Jong, M., & Flannigan, M. (2024). Drought triggers and sustains overnight fires in North America. Nature, 627(8003), 321-327.
- McKee, T. B., Doesken, N. J., & Kleist, J. (1993). The relationship of drought frequency and duration to time scales. Proceedings of the 8th Conference on Applied Climatology, 179–184. American Meteorological Society.
- Mukherjee, S., Mishra, A., & Trenberth, K. E. (2018). Climate change and drought: a perspective on drought indices. Current climate change reports, 4, 145-163.
- National Center for Environmental Information (2024). Billion-dollar weather and climate disaster. Retrieved from NOAA.
- National Oceanic and Atmospheric Administration & National Integrated Drought Information System. (2025, May 14). Drought brings the heat: New research finds drought lengthens heat waves. Retrieved from Drought.gov.
- Nwayor, I. J., Robeson, S. M., Ficklin, D. L., & Maxwell, J. T. (2024). A Multiscalar Standardized Vapor Pressure Deficit Index for Drought Monitoring and Impacts. International Journal of Climatology.
- Schechinger, A. (2023, November 1). Crop insurance pays farmers billions of dollars for weather-related losses closely linked to the climate crisis. Retrieved from Environmental Working Group.
- Vicente-Serrano, S. M., Beguería, S., & López-Moreno, J. I. (2010). A multiscalar drought index sensitive to global warming: the standardized precipitation evapotranspiration index. Journal of Climate, 23(7), 1696-1718.